Rural Health
Resources by Type: Map/Mapping System
Oklahoma Counties by Rural-Urban Continuum Codes, 2013
Provides a map showing counties in Oklahoma shaded by metro/nonmetro rural-urban continuum codes.
Date: 03/2019
Sponsoring organization: Oklahoma State University Center for Rural Health
view details
Provides a map showing counties in Oklahoma shaded by metro/nonmetro rural-urban continuum codes.
Date: 03/2019
Sponsoring organization: Oklahoma State University Center for Rural Health
view details
Improving Rural Net Migration Rates Were Most Common in Recreation and Retirement Destinations
Map showing the change in net migration rates in nonmetropolitan counties from 2012-2013 to 2016-2017.
Date: 03/2019
Sponsoring organization: USDA Economic Research Service
view details
Map showing the change in net migration rates in nonmetropolitan counties from 2012-2013 to 2016-2017.
Date: 03/2019
Sponsoring organization: USDA Economic Research Service
view details
Medically Underserved Areas/Populations - Delaware 2019
State map showing Medically Underserved Populations and Medically Underserved Areas in Delaware as of 2019.
Date: 02/2019
Sponsoring organization: Delaware Health Statistics Center
view details
State map showing Medically Underserved Populations and Medically Underserved Areas in Delaware as of 2019.
Date: 02/2019
Sponsoring organization: Delaware Health Statistics Center
view details
Nebraska Federal Health Professional Shortage Areas (HPSAs) Primary Care 2019
County-level map showing locations of Rural Health Clinics, Indian Health Services, community health centers, correctional facilities, and single county primary care HPSAs.
Date: 01/2019
Sponsoring organization: Nebraska Department of Health and Human Services
view details
County-level map showing locations of Rural Health Clinics, Indian Health Services, community health centers, correctional facilities, and single county primary care HPSAs.
Date: 01/2019
Sponsoring organization: Nebraska Department of Health and Human Services
view details
Nebraska Federal Health Professional Shortage Areas (HPSAs) Mental Health 2019
County-level map showing locations of Nebraska Rural Health Clinics with Mental Health HPSAs, Indian Health Services, and community health centers.
Date: 01/2019
Sponsoring organization: Nebraska Department of Health and Human Services
view details
County-level map showing locations of Nebraska Rural Health Clinics with Mental Health HPSAs, Indian Health Services, and community health centers.
Date: 01/2019
Sponsoring organization: Nebraska Department of Health and Human Services
view details
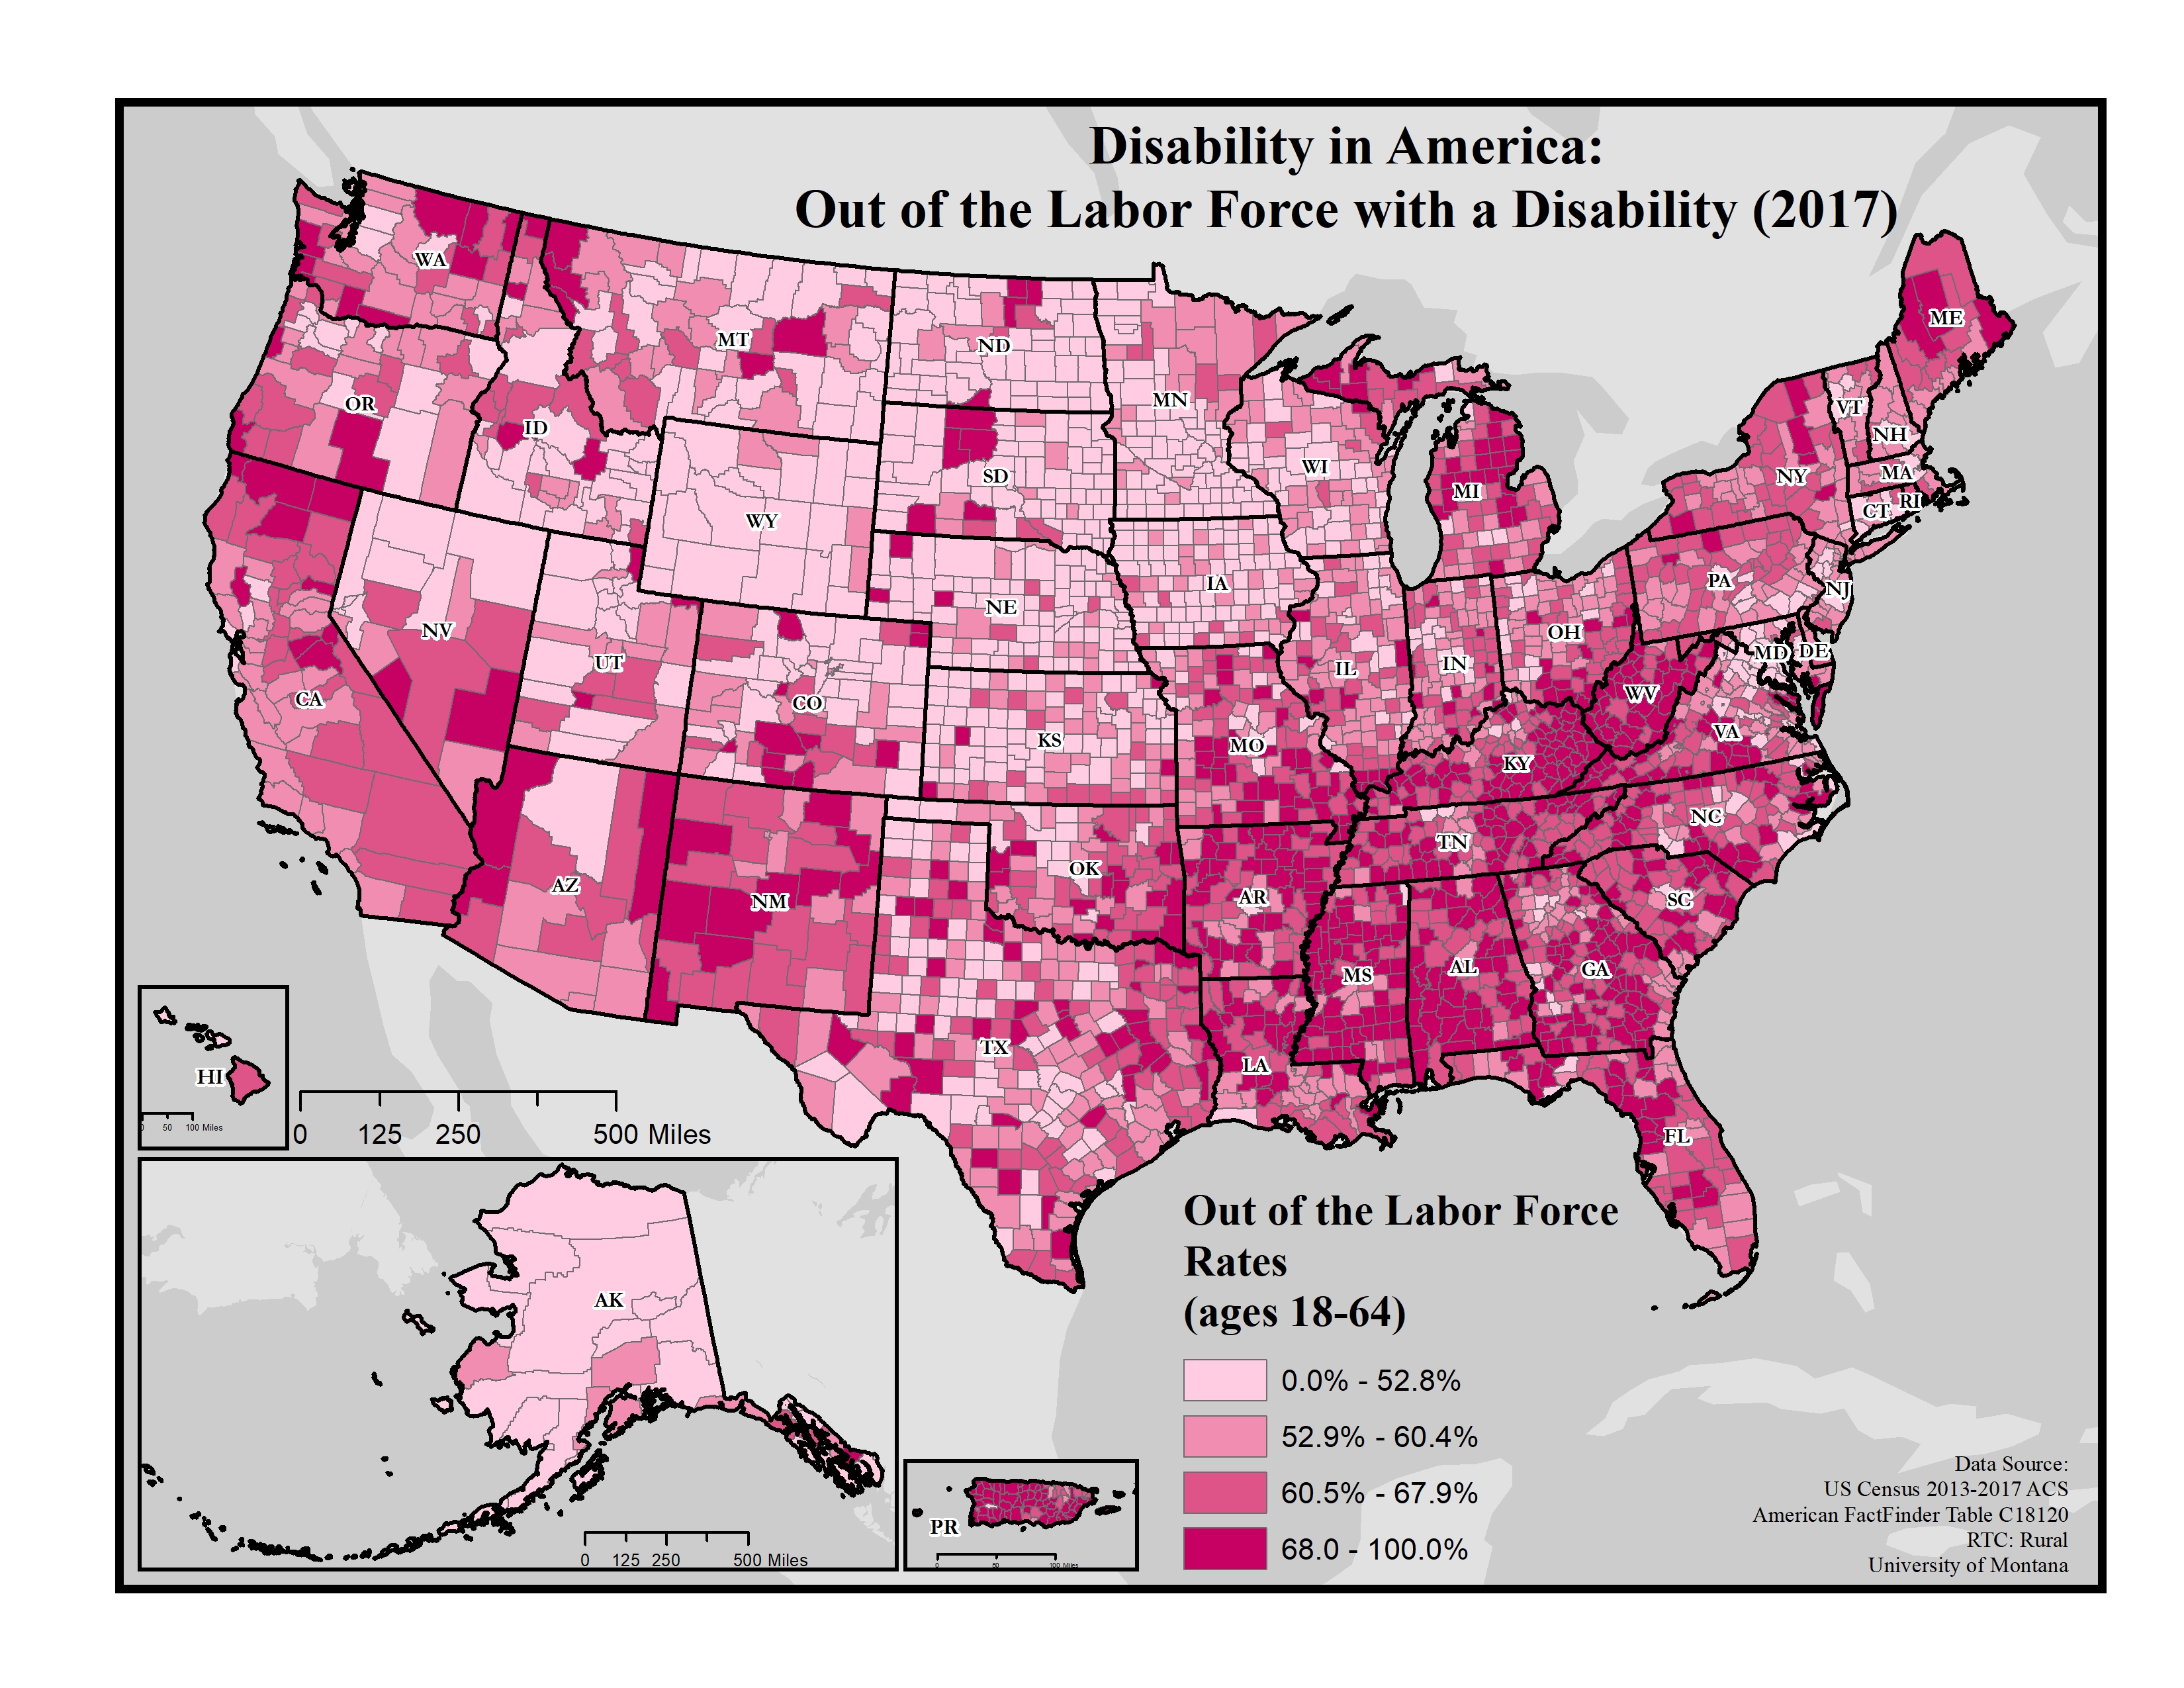
Disability in America: Out of the Labor Force with a Disability (2017)
Displays the rate of adults 18 to 64 years old with a disability who are out of the labor force by county using data from the 2013-2017 American Community Survey (ACS).
Date: 01/2019
Sponsoring organization: Research and Training Center on Disability in Rural Communities
view details
Displays the rate of adults 18 to 64 years old with a disability who are out of the labor force by county using data from the 2013-2017 American Community Survey (ACS).
Date: 01/2019
Sponsoring organization: Research and Training Center on Disability in Rural Communities
view details
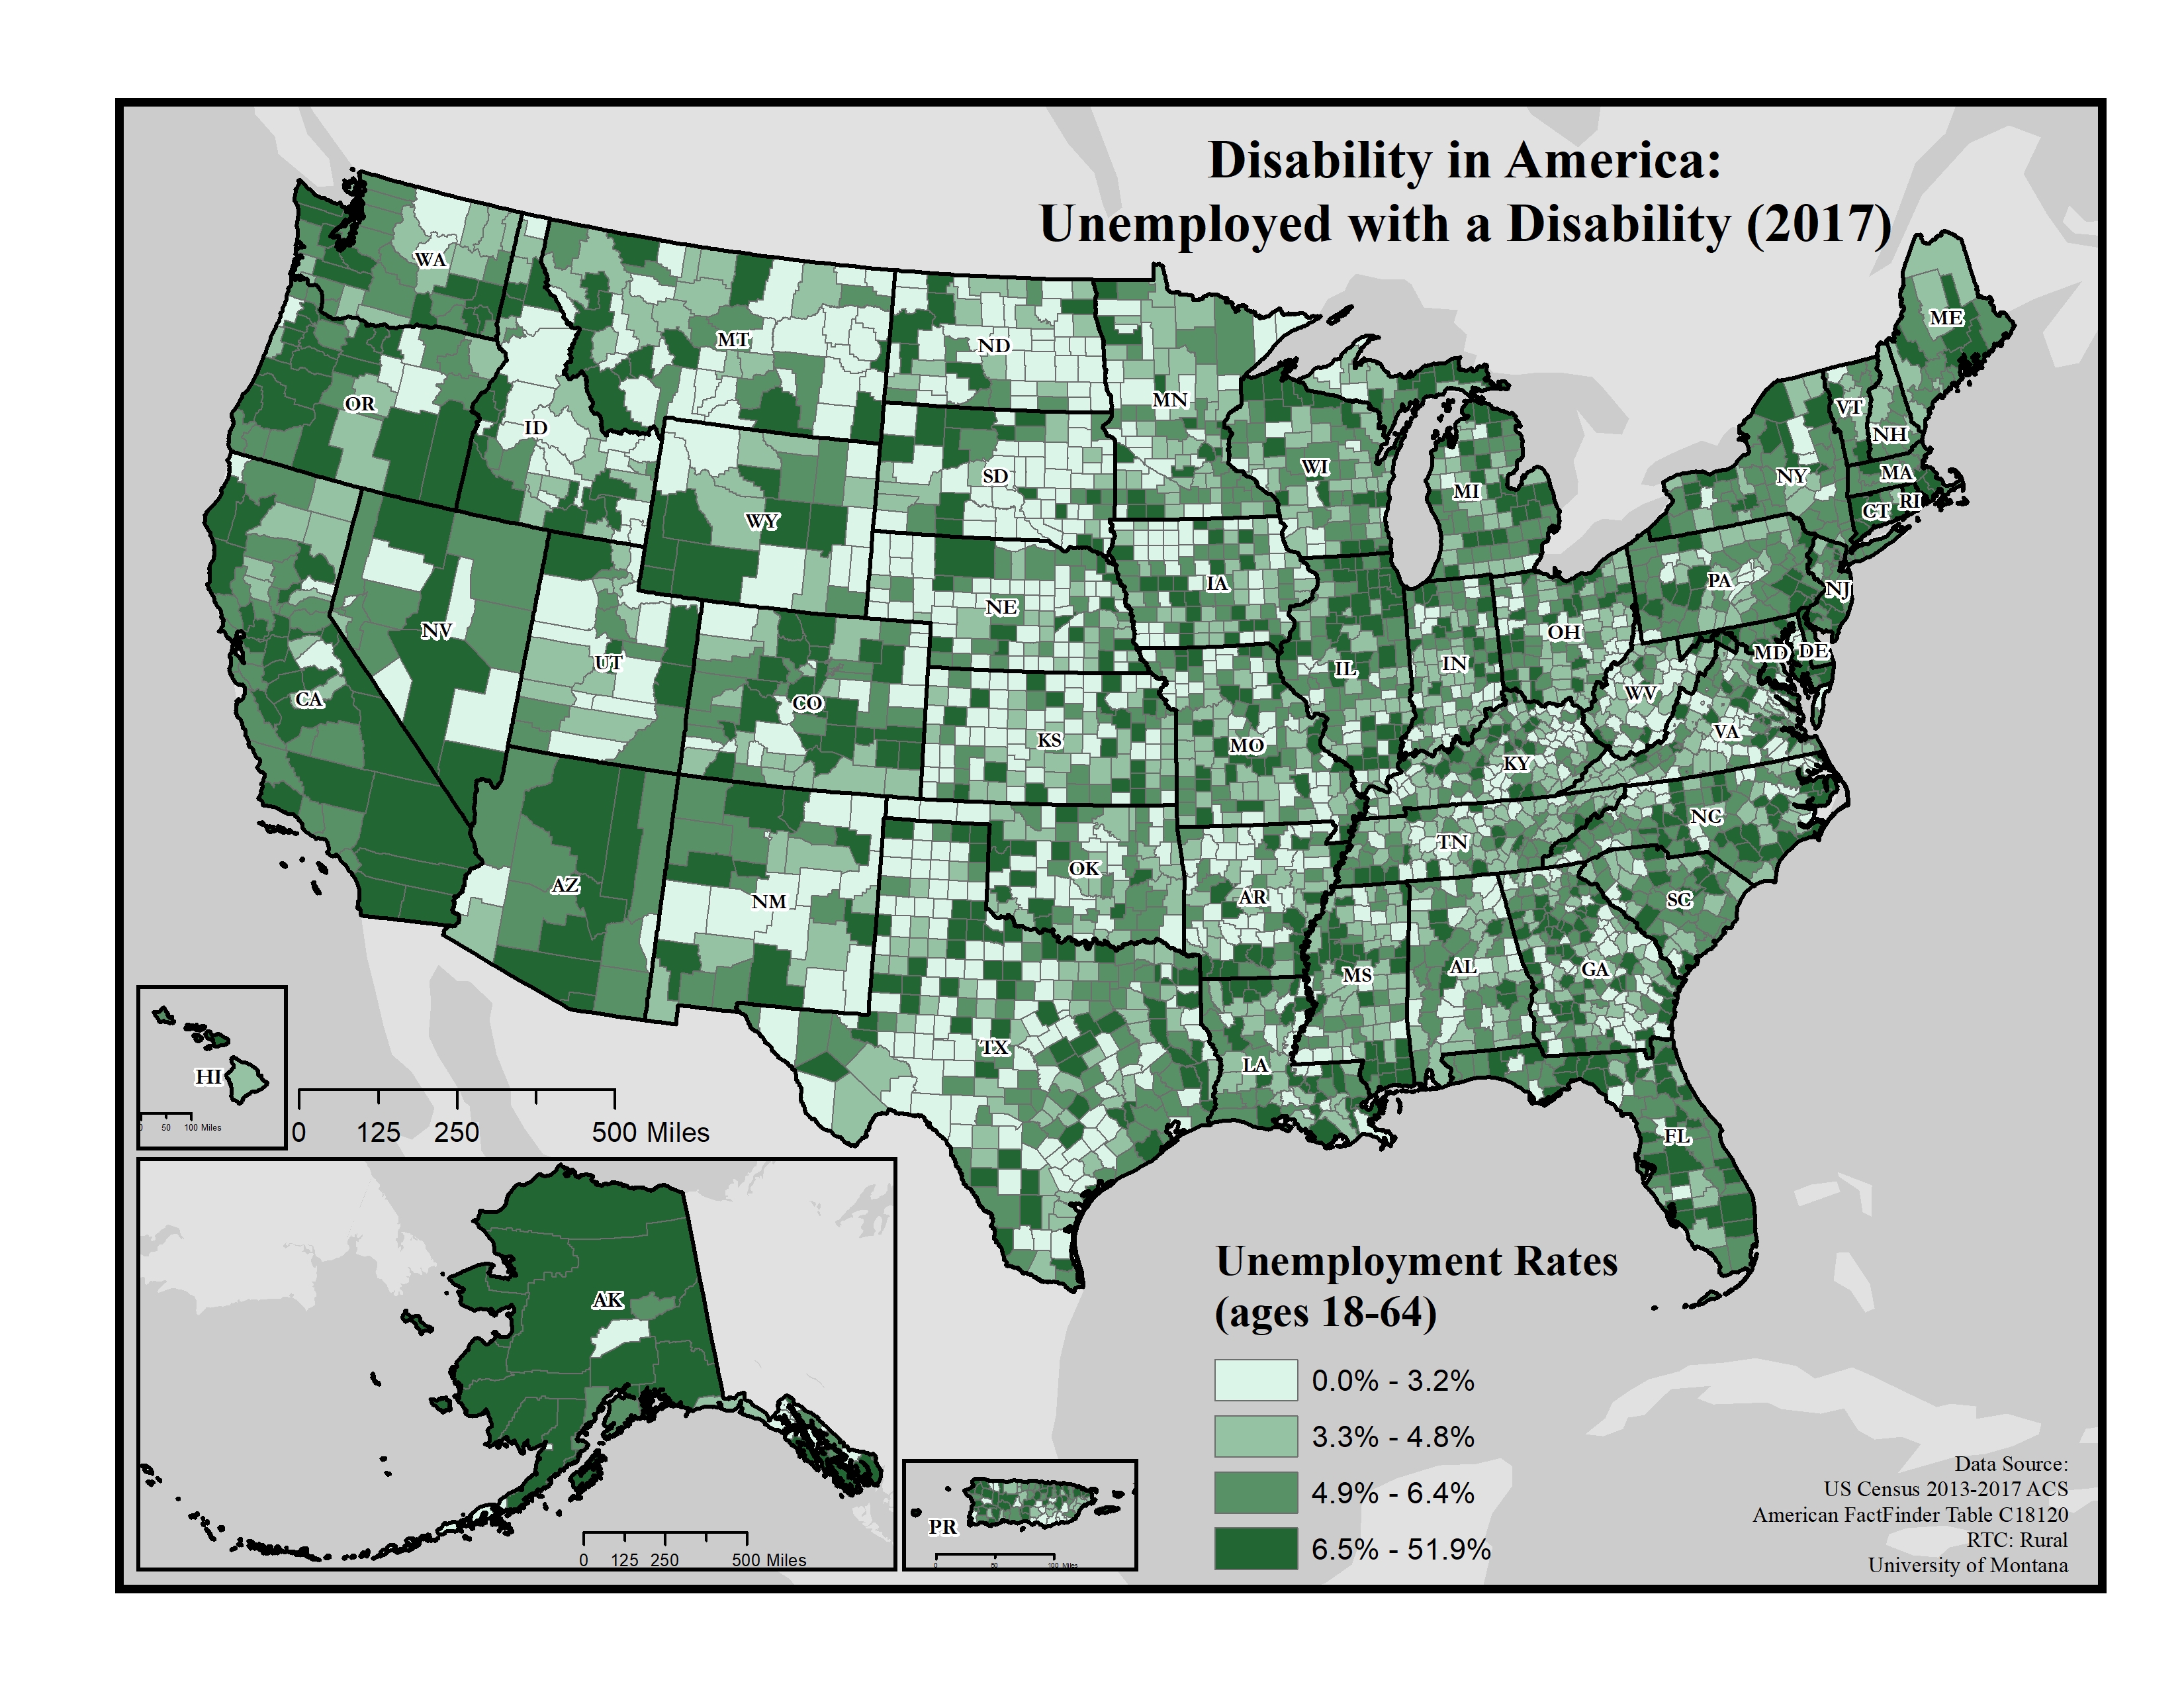
Disability in America: Unemployed with a Disability (2017)
Displays the unemployment rates among adults 18 to 64 years old with a disability on the county level using data from the 2013-2017 American Community Survey (ACS).
Date: 01/2019
Sponsoring organization: Research and Training Center on Disability in Rural Communities
view details
Displays the unemployment rates among adults 18 to 64 years old with a disability on the county level using data from the 2013-2017 American Community Survey (ACS).
Date: 01/2019
Sponsoring organization: Research and Training Center on Disability in Rural Communities
view details
Disability in America: Employed with a Disability (2017)
Displays the employment rates among adults 18 to 64 years old with a disability on the county level using data from the 2013-2017 American Community Survey (ACS).
Date: 01/2019
Sponsoring organization: Research and Training Center on Disability in Rural Communities
view details
Displays the employment rates among adults 18 to 64 years old with a disability on the county level using data from the 2013-2017 American Community Survey (ACS).
Date: 01/2019
Sponsoring organization: Research and Training Center on Disability in Rural Communities
view details
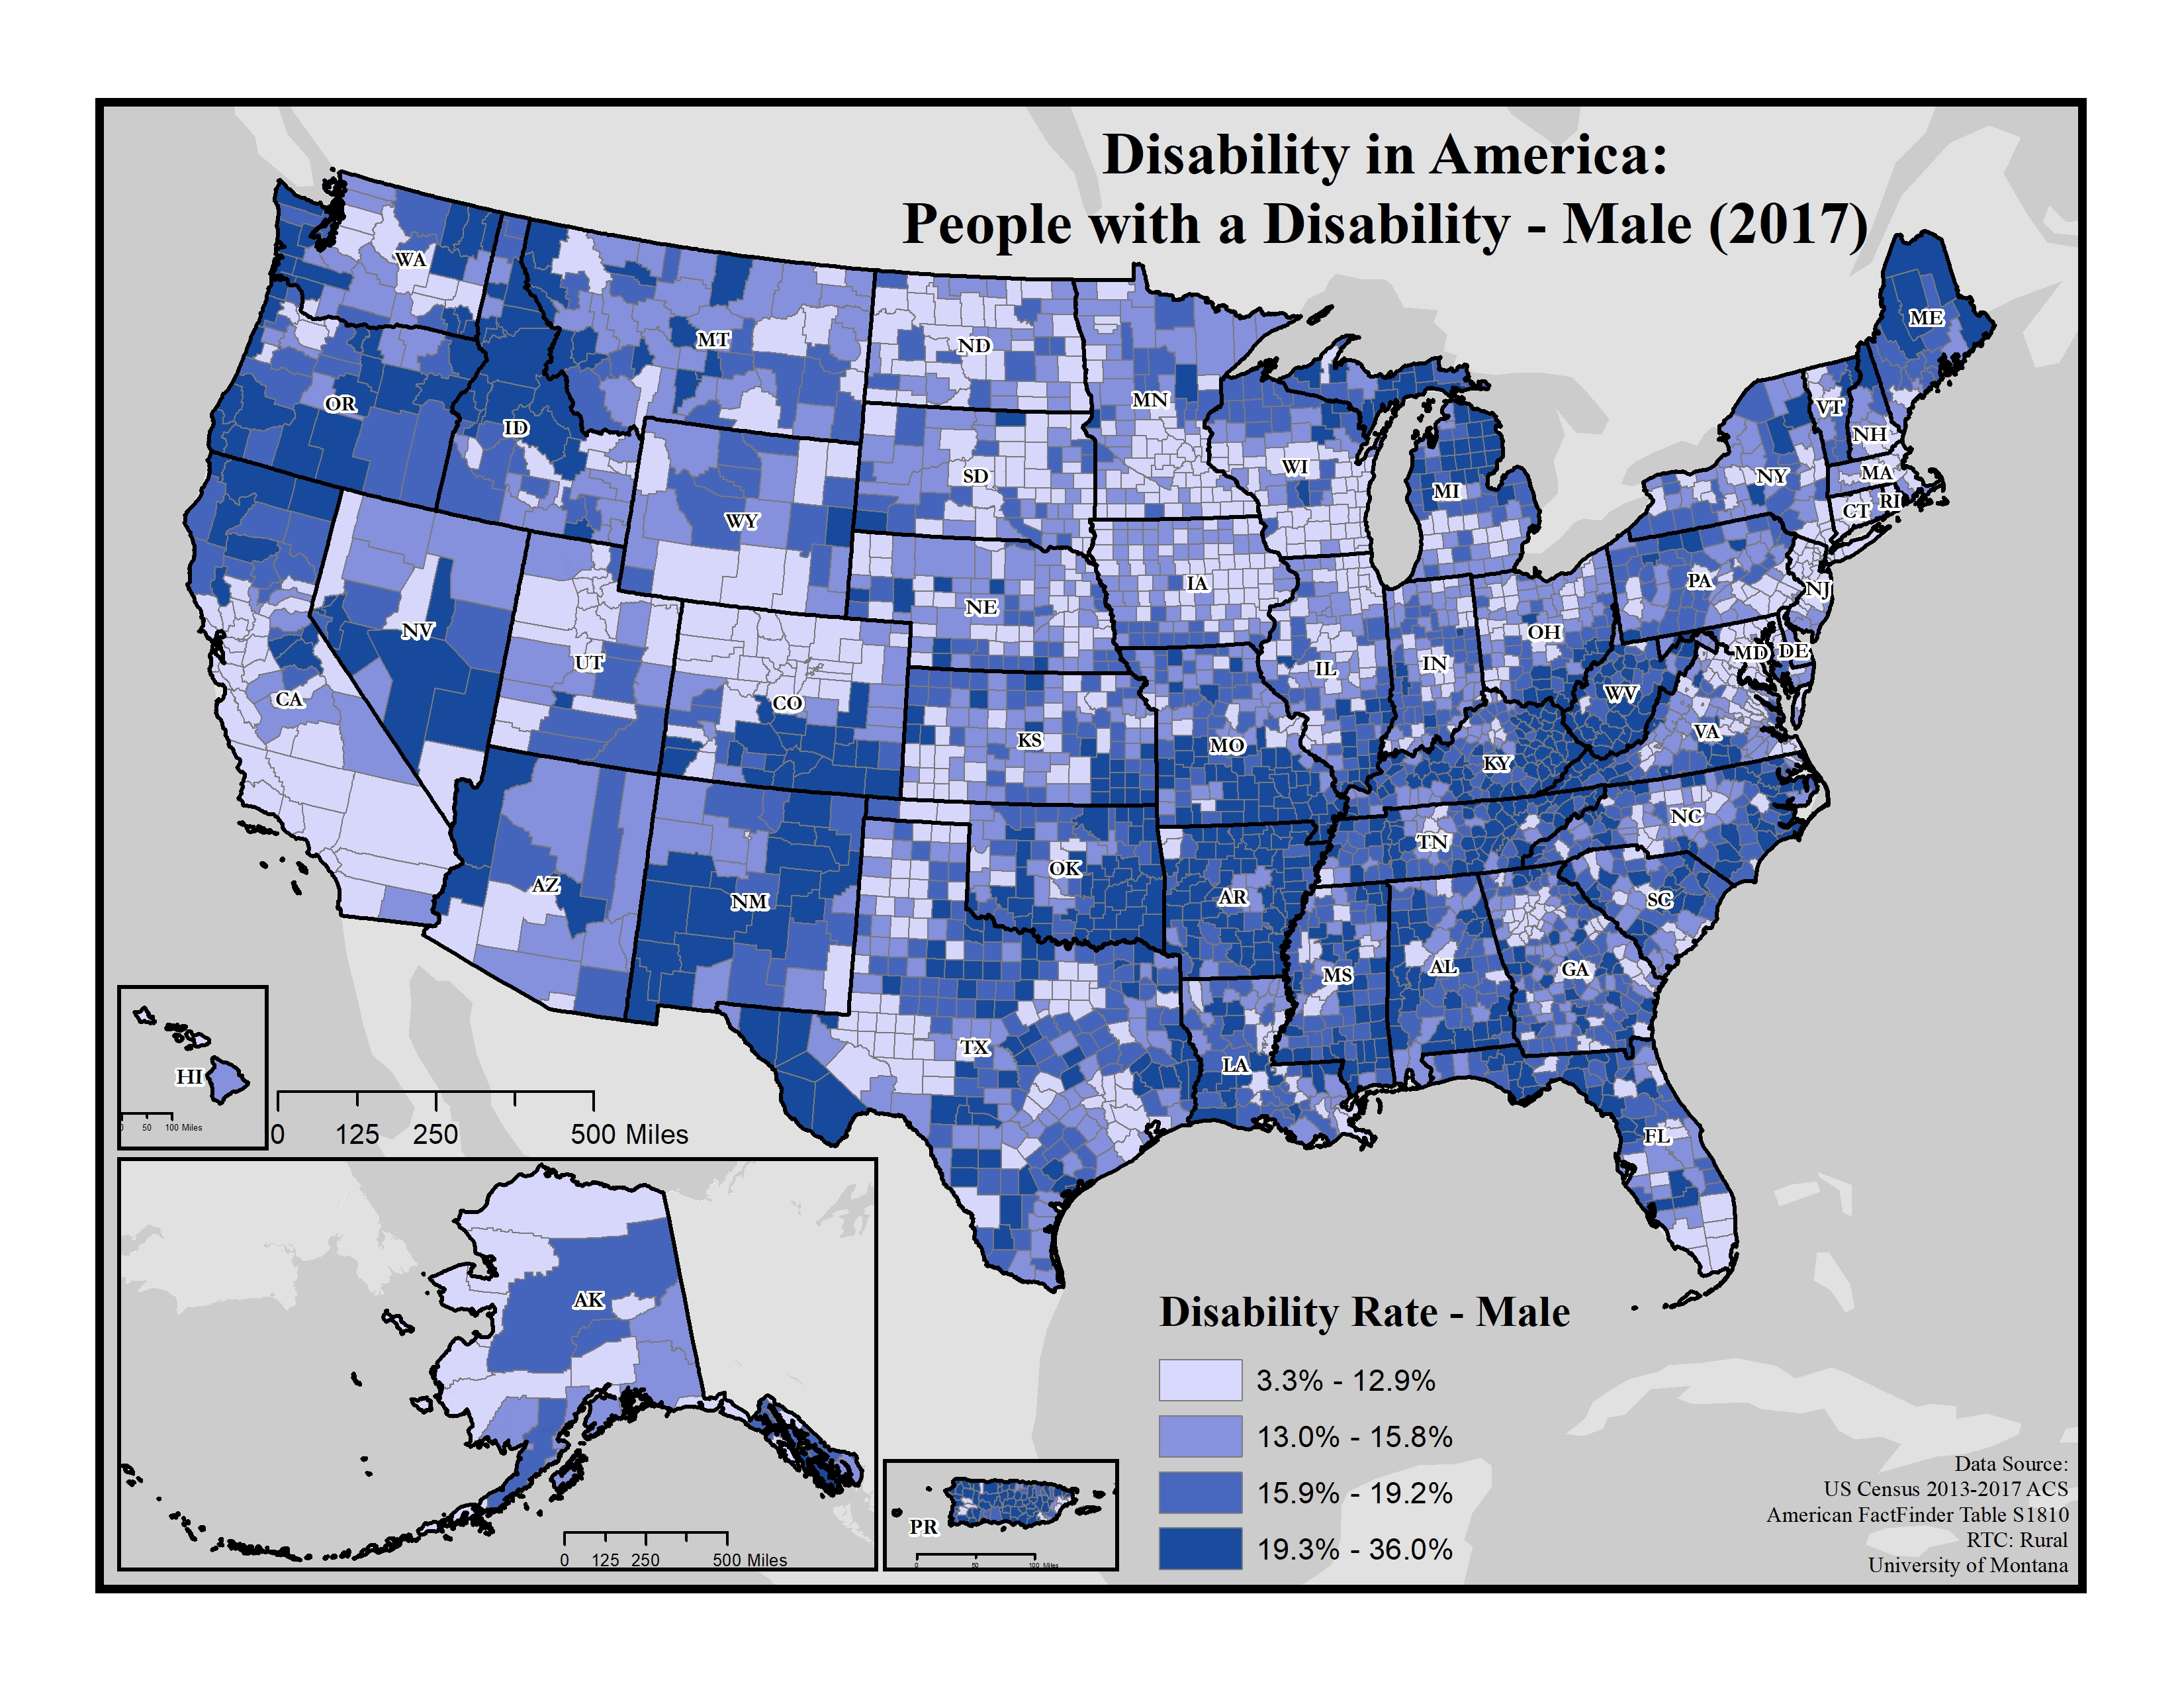
Disability in America: People with a Disability - Male (2017)
Displays disability rates among males on the county level using data from the 2013-2017 American Community Survey (ACS).
Date: 01/2019
Sponsoring organization: Research and Training Center on Disability in Rural Communities
view details
Displays disability rates among males on the county level using data from the 2013-2017 American Community Survey (ACS).
Date: 01/2019
Sponsoring organization: Research and Training Center on Disability in Rural Communities
view details
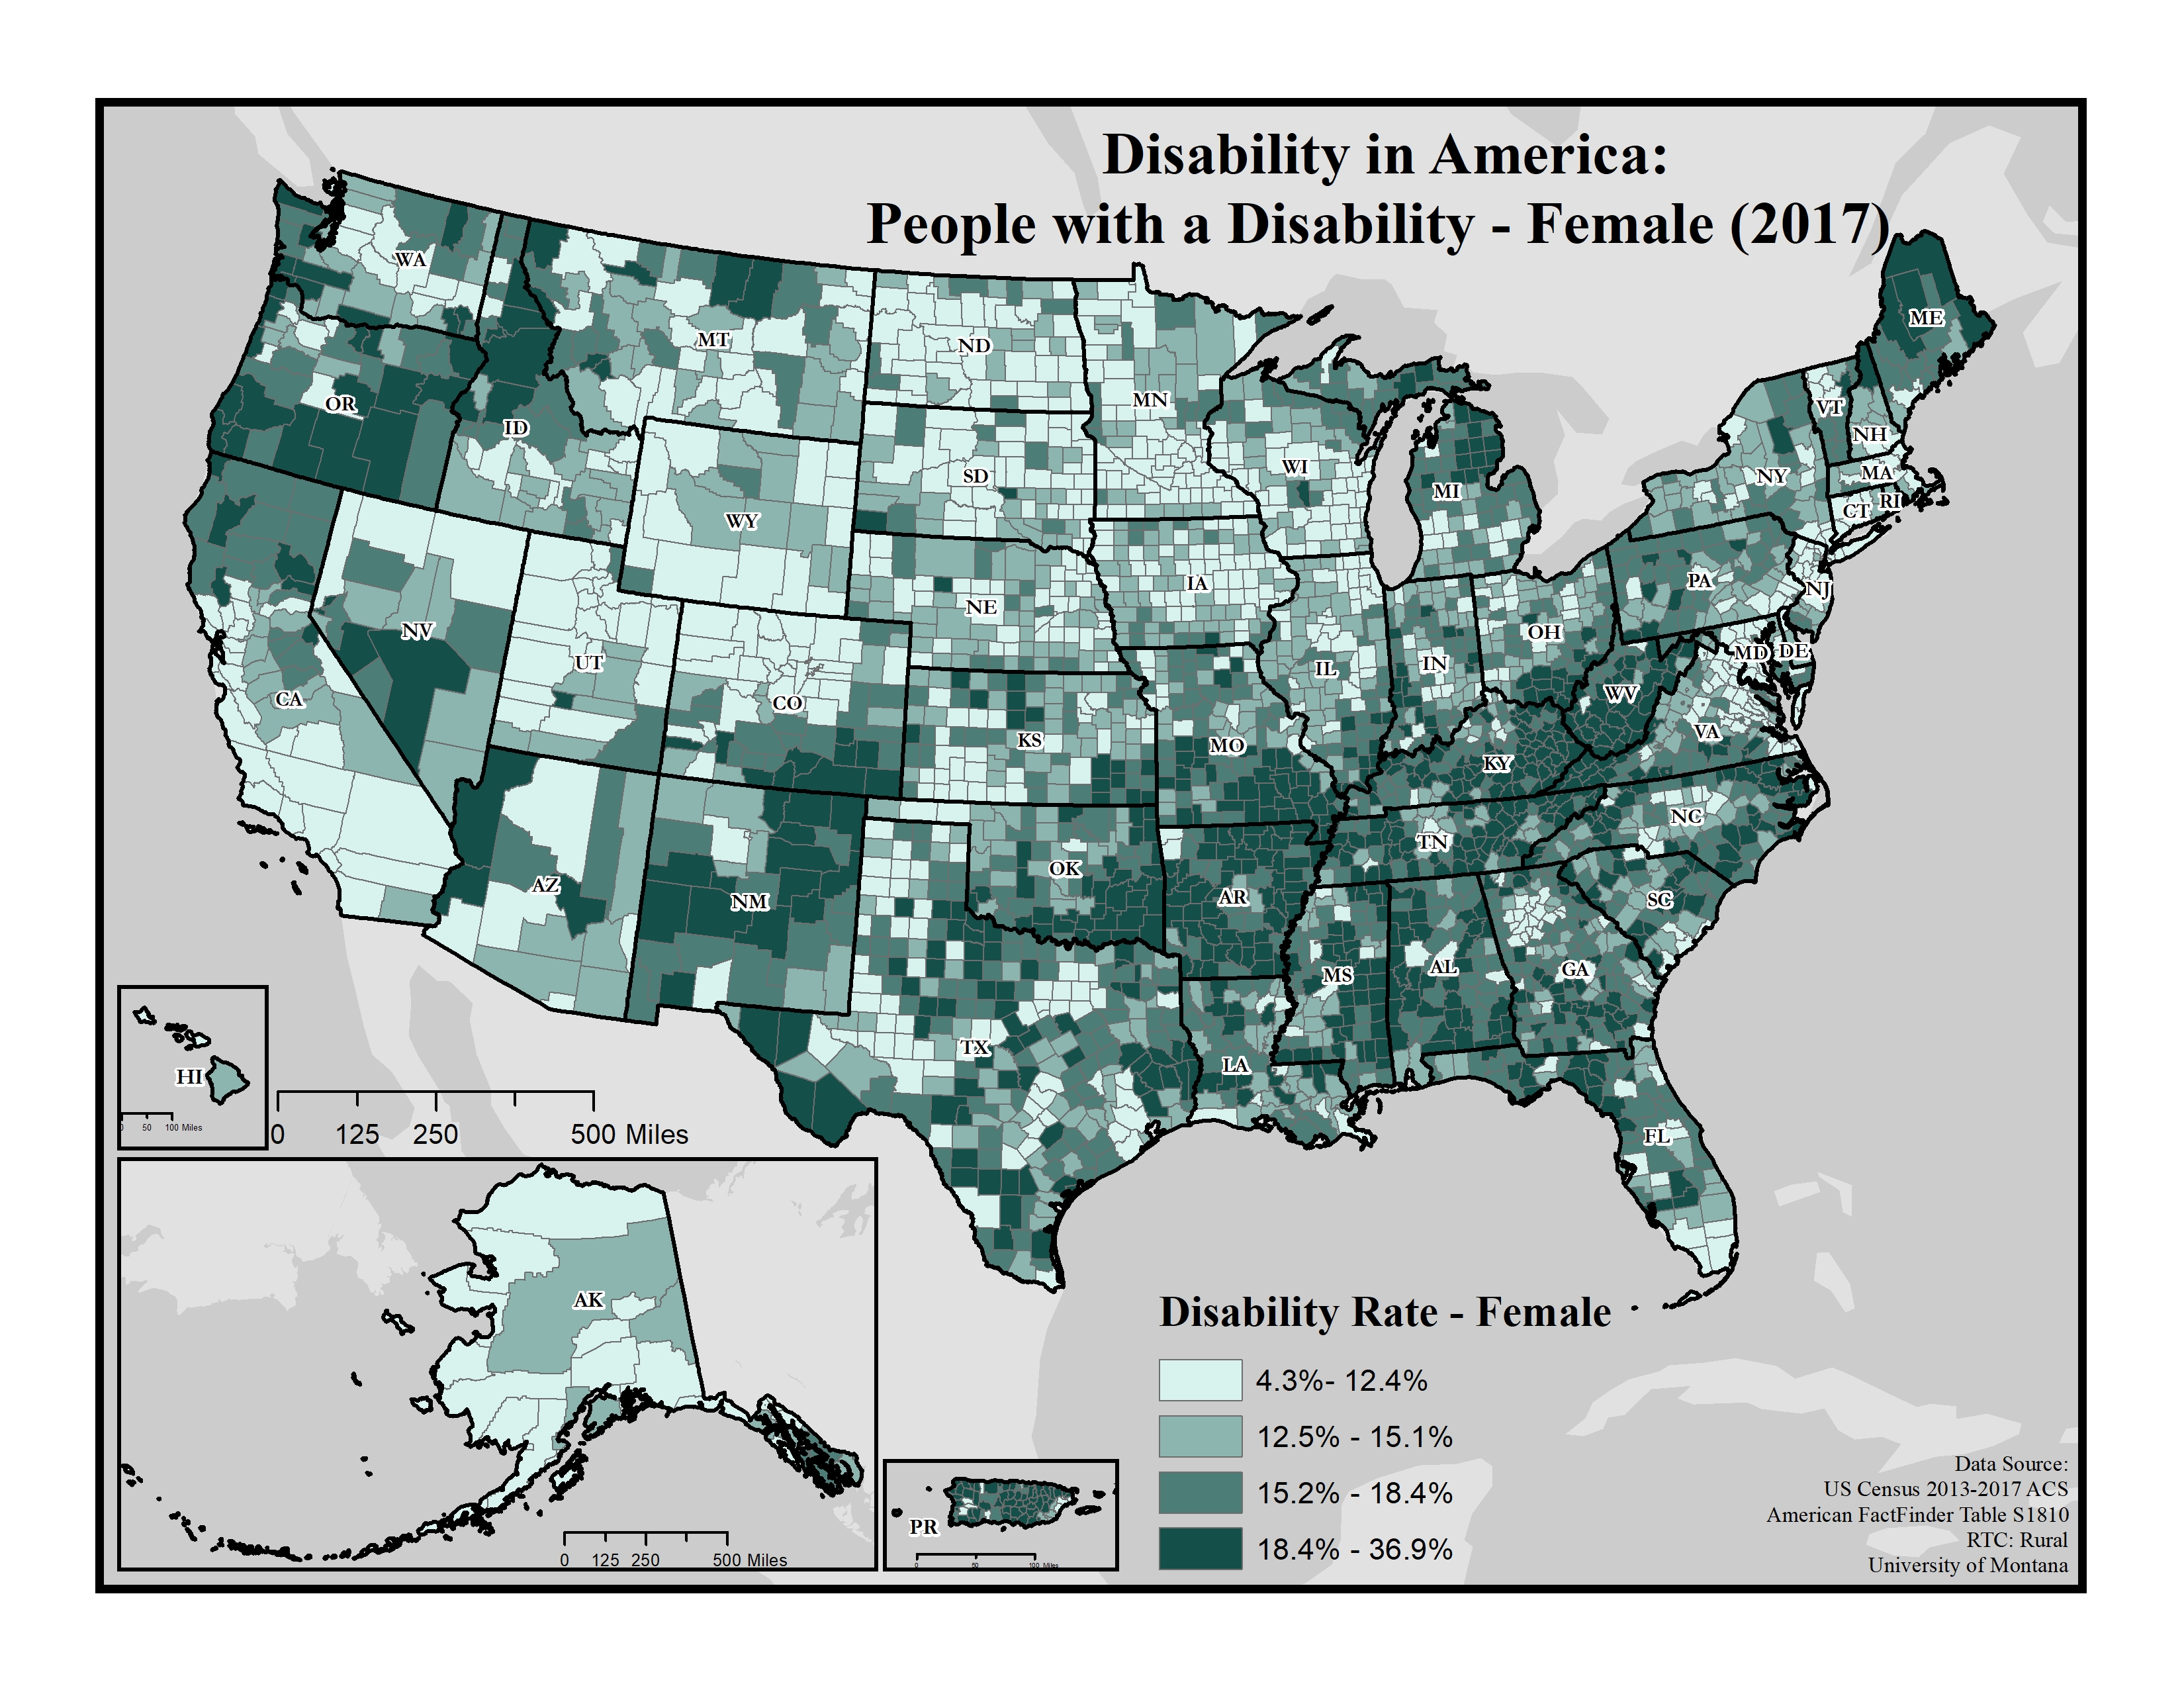
Disability in America: People with a Disability - Female (2017)
Displays disability rates among females on the county level using data from the 2013-2017 American Community Survey (ACS).
Date: 01/2019
Sponsoring organization: Research and Training Center on Disability in Rural Communities
view details
Displays disability rates among females on the county level using data from the 2013-2017 American Community Survey (ACS).
Date: 01/2019
Sponsoring organization: Research and Training Center on Disability in Rural Communities
view details