Rural Health
Resources by Topic: County-by-county data
California County Fact Sheets: Treatment Gaps in Opioid-Agonist Medication Assisted Therapy (OA-MAT) and Estimates of How Many Additional Prescribers Are Needed
Presents county-level estimates of opioid use disorder rates and treatment needs in California. Features statistics including opioid overdose deaths, buprenorphine prescriptions, number of treatment programs, and estimates of buprenorphine-waivered prescribers.
Author(s): Lisa Clemans-Cope, Marni Epstein, Douglas A. Wissoker, Joshua Aarons
Date: 11/2019
Sponsoring organization: Urban Institute
view details
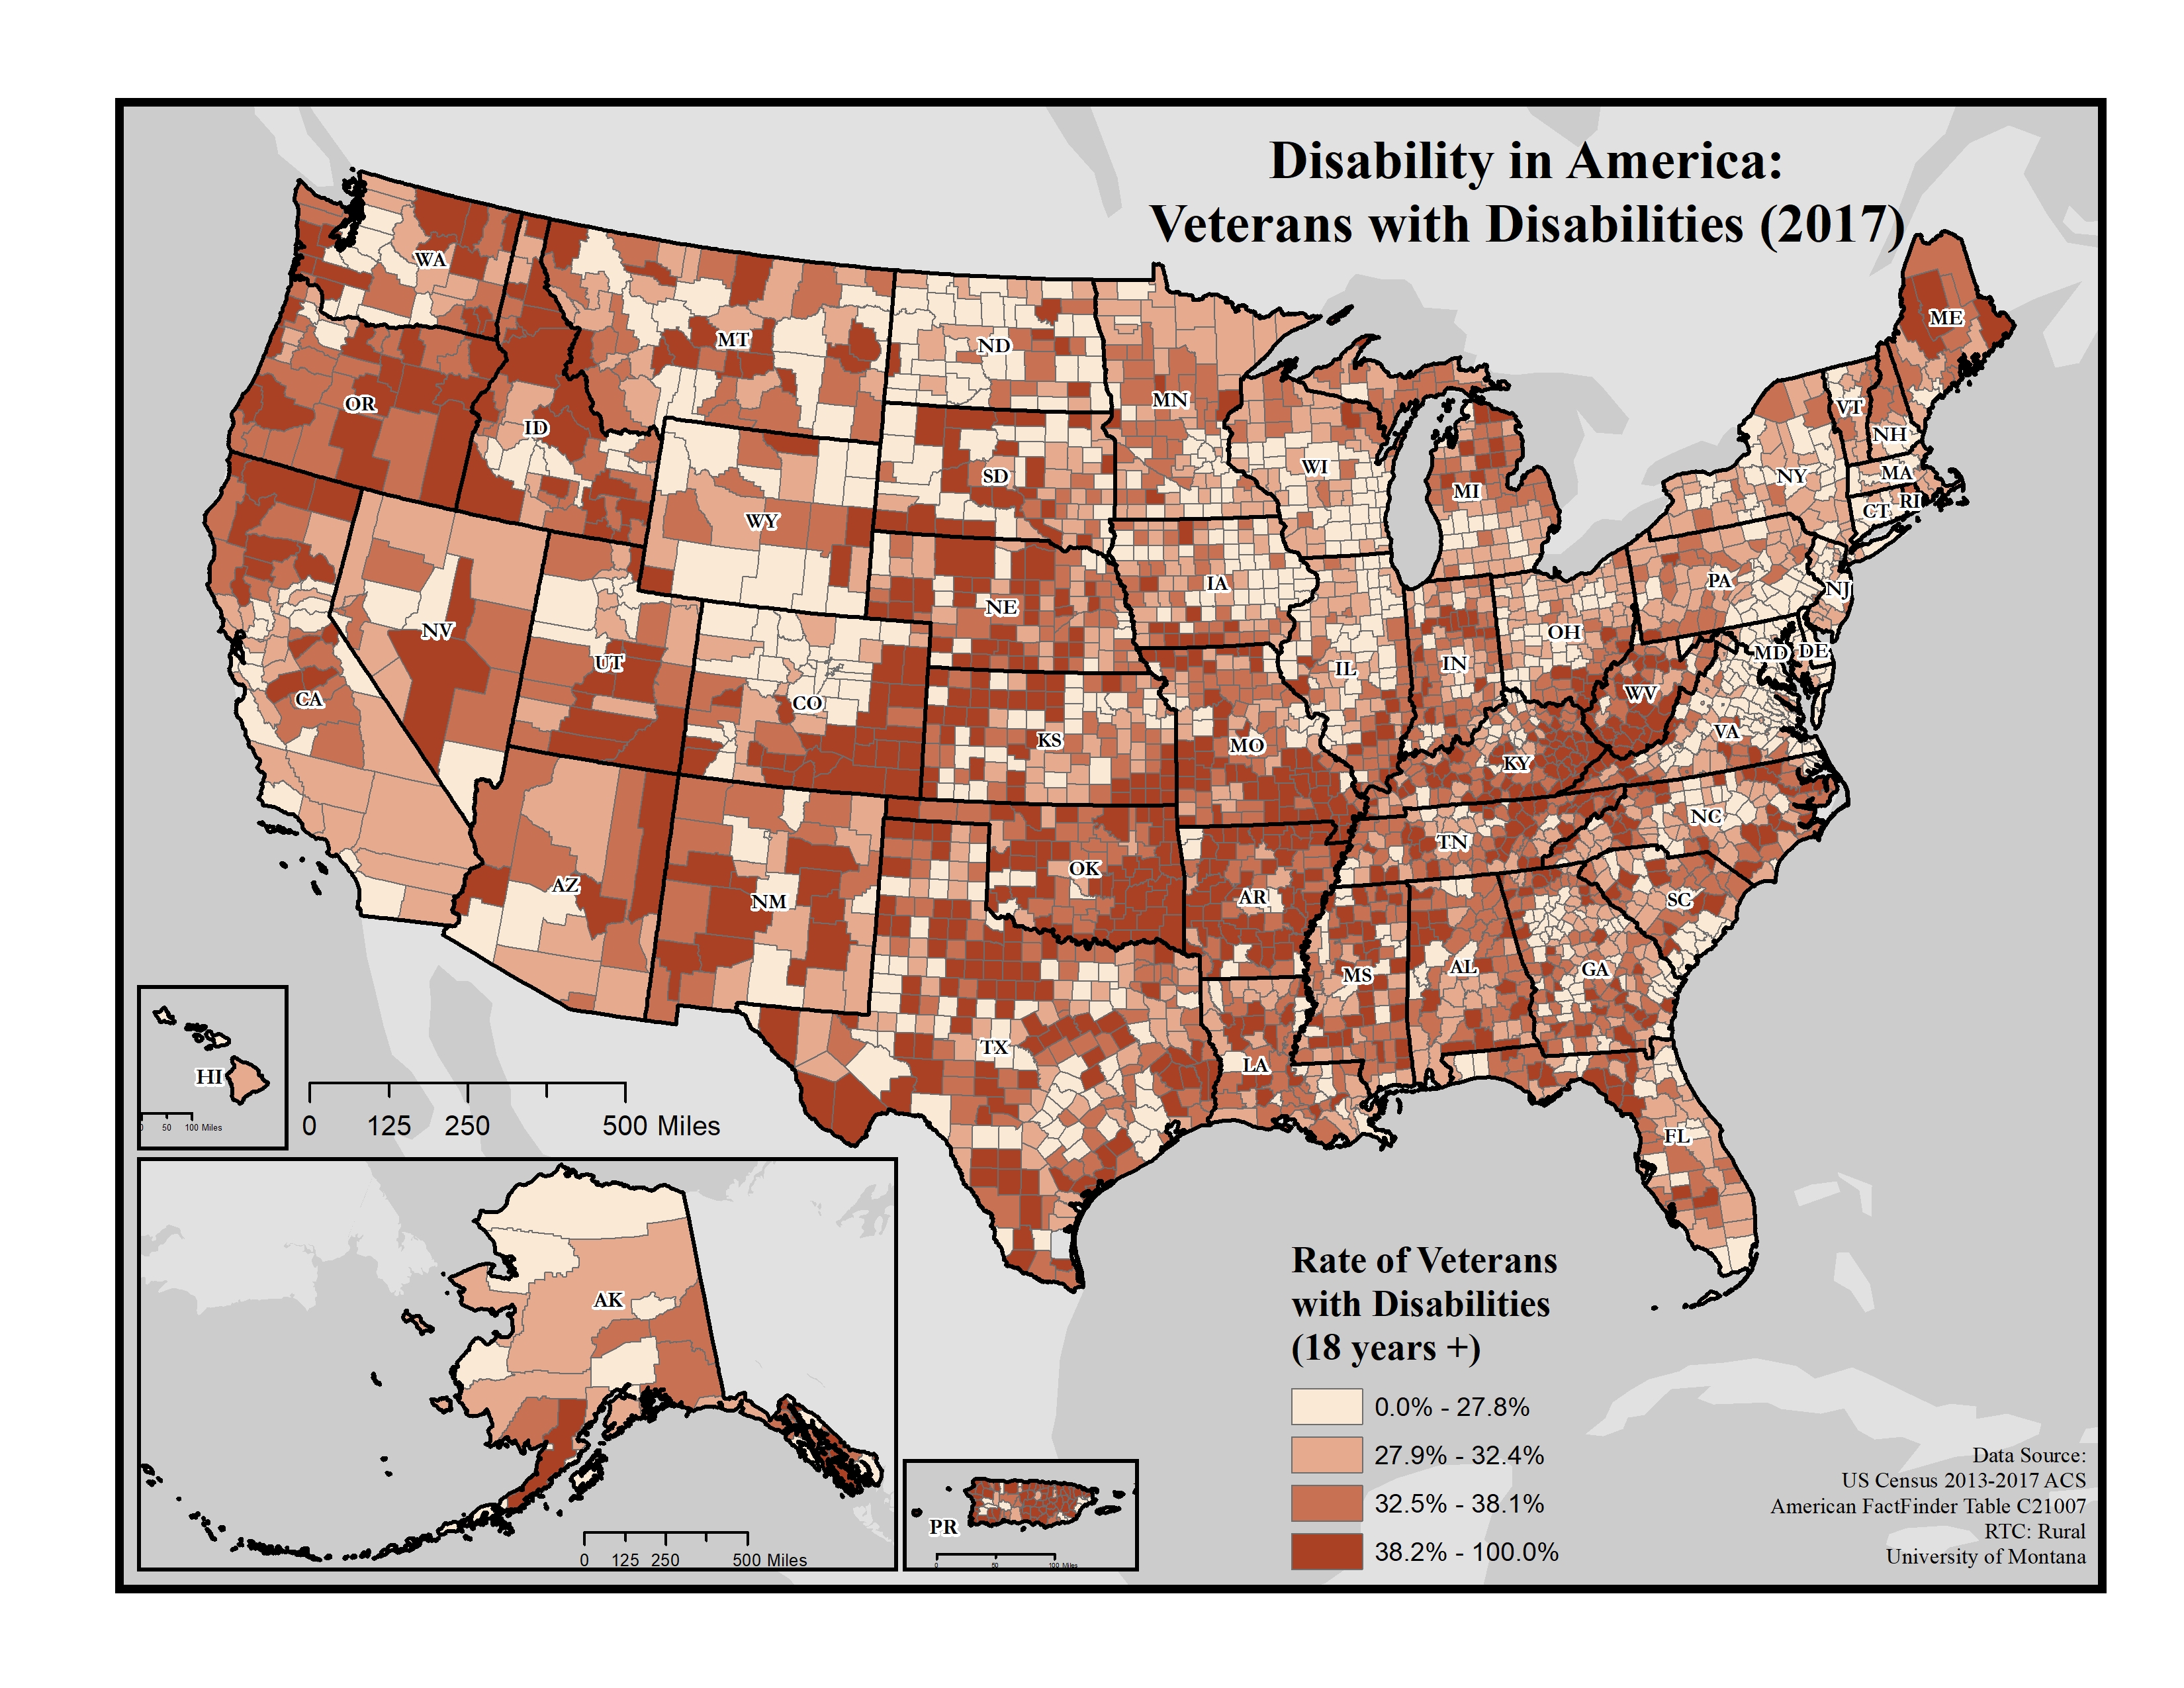
Disability in America: Veterans with Disabilities (2017)
Displays the disability rate among veterans on the county level using data from the 2013-2017 American Community Survey (ACS).
Date: 10/2019
Sponsoring organization: Research and Training Center on Disability in Rural Communities
view details
Displays the disability rate among veterans on the county level using data from the 2013-2017 American Community Survey (ACS).
Date: 10/2019
Sponsoring organization: Research and Training Center on Disability in Rural Communities
view details
California's Midwives: How Scope of Practice Laws Impact Care
Compares the scope of practice, professional licensures, regulatory systems, and educational requirements for licensed midwives (LMs) and nurse-midwives (NMs) in California. Appendix provides per capita distribution data for midwives by county within the state.
Author(s): Connie Kwong, Margot Brooks, Kim Q. Dau, Joanne Spetz
Date: 10/2019
Sponsoring organization: Healthforce Center at UCSF
view details
Traumatic Injury and Access to Care in Rural Areas: Leveraging Linked Data and Geographic Information Systems for Planning and Advocacy
Analyzes county-level data representing traumatic injury rates in rural Colorado. Discusses challenges to trauma care in rural areas, including distance to trauma centers, rates of injury, prevention resources, EMS response times, and limited EMS capacity. Includes county-level maps showing transportation time to trauma centers, mortality rates, and hospitalization rates for traumatic injury.
Author(s): Paula Yuma, Rebecca Orsi, Julie Dunn, et al.
Citation: Rural Remote Health, 19(3), 5089
Date: 09/2019
view details
Wyoming Vital Statistics Services - 2018 Annual Report
Provides vital statistics for the state of Wyoming, including data on birth rate, teen births, death rate, cause of death, and more. Tables include county-level data and show change over time.
Author(s): Guy Beaudoin, Mariah Storey
Date: 09/2019
Sponsoring organization: Wyoming Department of Health
view details
A New Portrait of Rural America
Examines nine different types of rural counties: the African American South, aging farmlands, evangelical hubs, graying America, Hispanic centers, LDS enclaves, Native American lands, rural middle America, and working class country. Reports on factors impacting rural communities overall and by county type, including health insurance coverage and health status as well as demographic and socioeconomic factors. Includes county-level data for all counties and features on individual counties for each county type.
Additional links: Interactive: Explore Rural America's Diversity, Report, Resources: Community Type Maps and Data, Videos: Rural Report Findings and Discussion With Community Leaders
Date: 09/2019
Sponsoring organization: American Communities Project
view details
Provider Shortages and Limited Availability of Behavioral Health Services in New Mexico's Medicaid Managed Care
Examines the supply and distribution of behavioral health providers and prescribers across New Mexico, with a focus on services available to Medicaid managed care enrollees. Includes data for rural and frontier counties. Discusses rural broadband connectivity challenges that impact the use of telehealth to address access. Offers policy recommendations. Findings are likely to be relevant to behavioral healthcare access in other states' rural and frontier counties.
Date: 09/2019
Sponsoring organization: Office of Inspector General (HHS)
view details
Utah's Mental Health System - A Collaborative Endeavor of the Kem C. Gardner Policy Institute and the Utah Hospital Association
Report details the mental health status in Utah. Highlights rates of mental health treatment among adults, youth depression and suicide indicators, and total student suicide risk by year. Features county level data and compares rural and urban counties.
Author(s): Laura Summers, Dianne Meppen, Samantha Ball
Date: 08/2019
view details
Select Maps on the Population 65 and Older in the United States by County: 2013-2017
Collection of maps showing county-level data on adults age 65 and older, with a focus on disability. Includes maps showing disability combined with living alone, widowhood, poverty status, and labor force participation.
Date: 08/2019
Sponsoring organization: U.S. Census Bureau
view details
Collection of maps showing county-level data on adults age 65 and older, with a focus on disability. Includes maps showing disability combined with living alone, widowhood, poverty status, and labor force participation.
Date: 08/2019
Sponsoring organization: U.S. Census Bureau
view details
The Geography of Uninsurance in Massachusetts: An Update for 2013-2017
Identifies high-uninsurance communities in Massachusetts using three measures: uninsurance rate, number of uninsured, and concentration of uninsured. Describes socioeconomic characteristics of high-uninsurance communities and uninsured residents. Supplemental tables include data by county, county subdivision, place, and additional geographies.
Additional links: Full Report
Author(s): Michael Karpman, Dulce Gonzalez, Sharon K. Long
Date: 08/2019
Sponsoring organizations: Blue Cross Blue Shield of Massachusetts Foundation, Urban Institute
view details